Live Market Intelligence
Analyze Deriv Synthetic Indices in Real Time
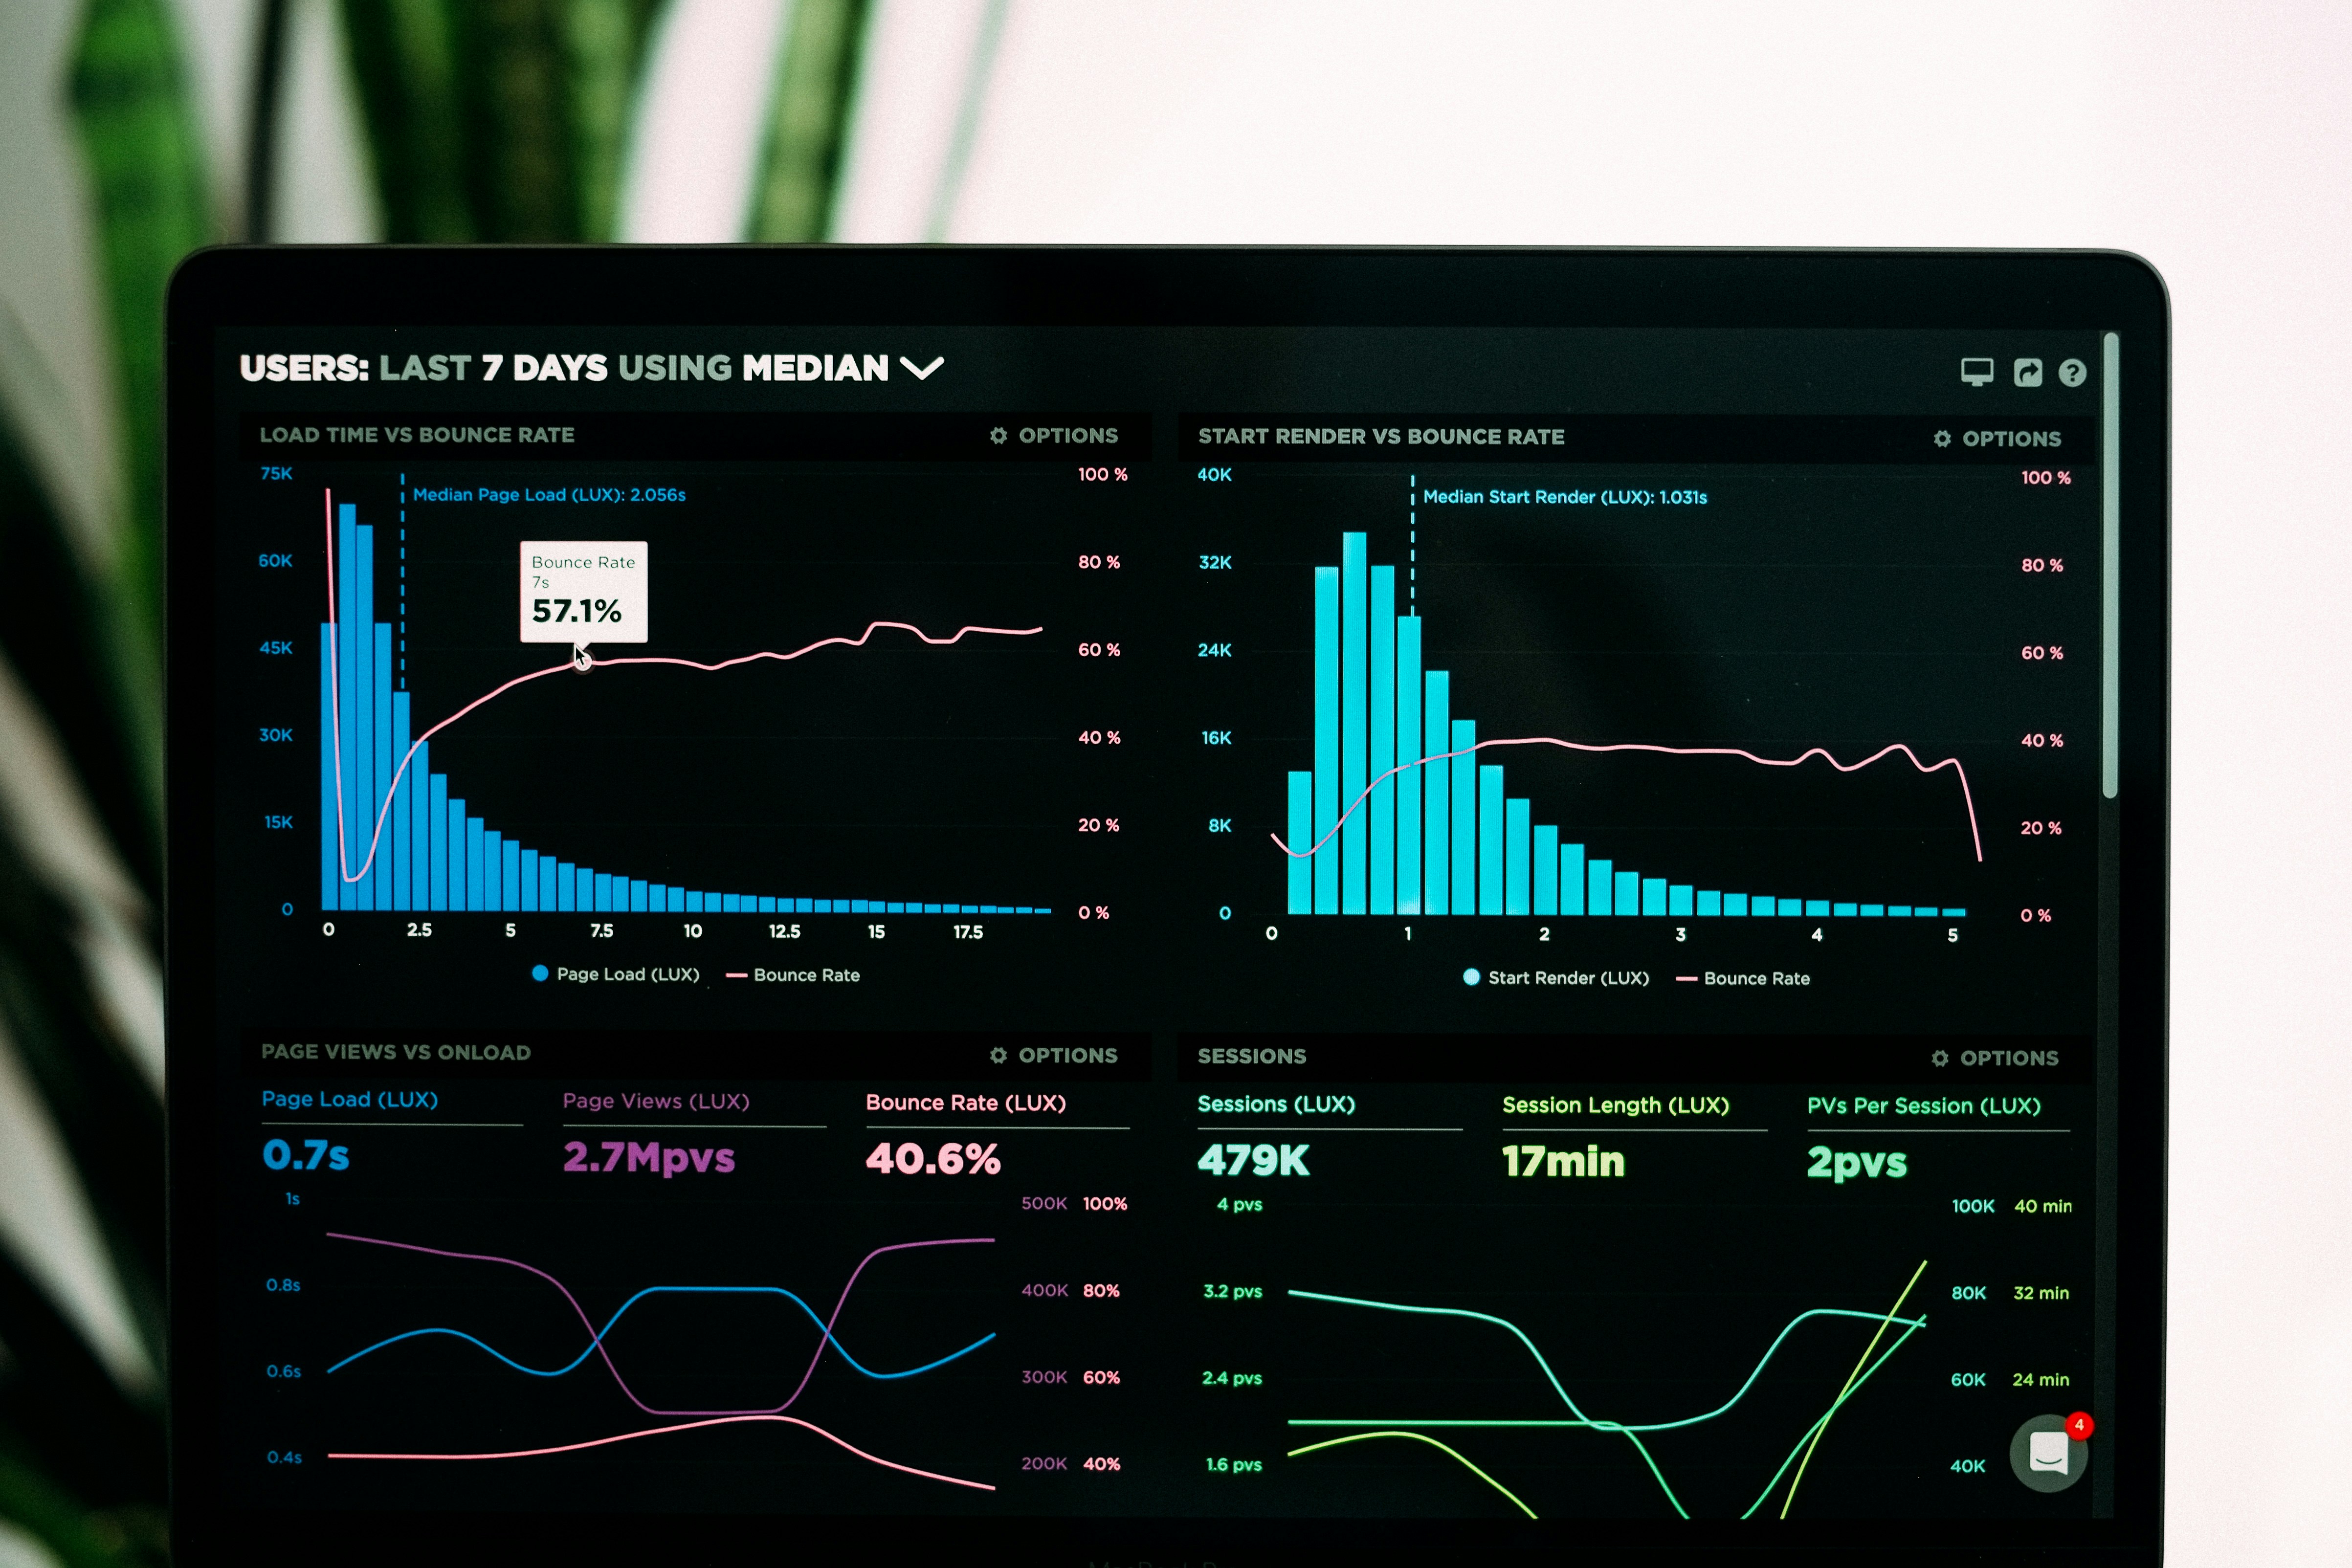
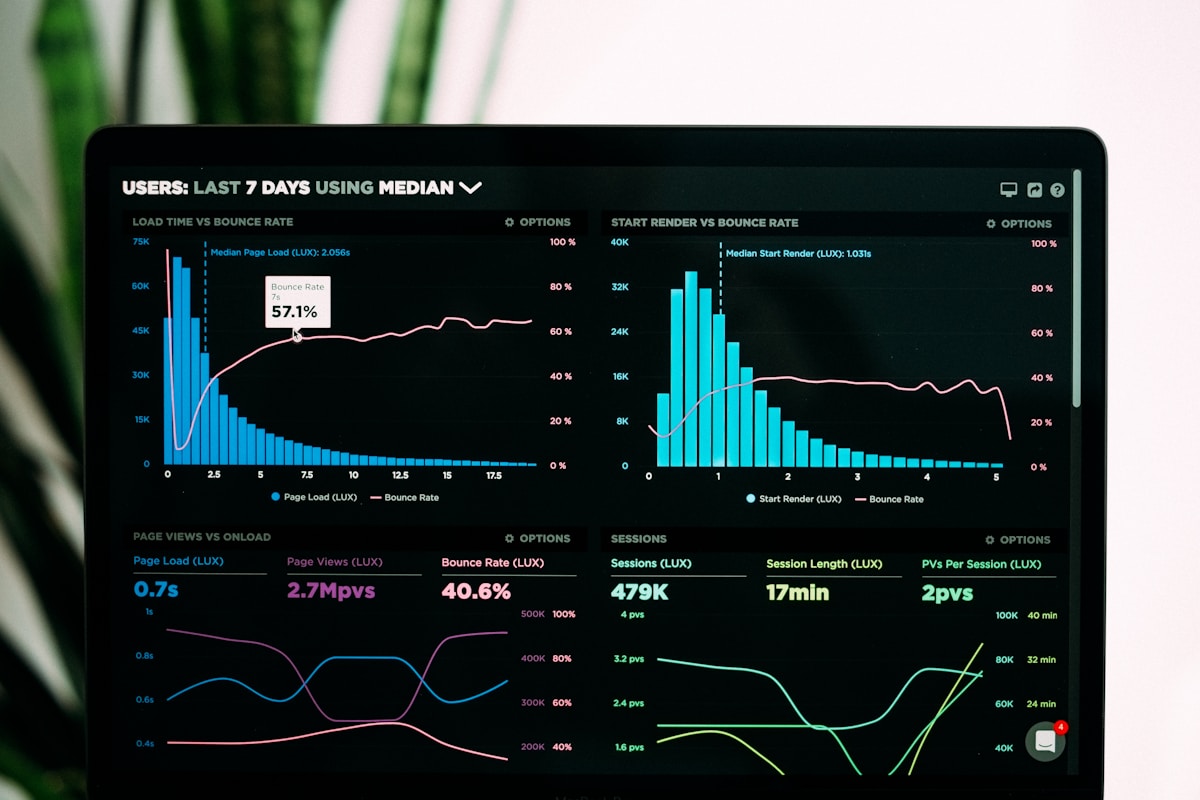
Track patterns, streaks, and digit frequencies across Volatility markets with live WebSocket data, advanced statistical insights, and paper-trade simulation—all in one powerful tool.
Deriv Digit Analysis
Deriv synthetic indices are generated by cryptographically secure random number generators. Each tick is independent and unpredictable.
Past statistical patterns do not predict future ticks. Historical data analysis is for educational and informational purposes only.
Trading synthetic indices carries a significant risk of loss. Only trade with money you can afford to lose.
This tool does not execute real trades and is not affiliated with or endorsed by Deriv. It is an independent analysis application.
The paper-trade simulator is for educational purposes only and does not reflect real trading conditions, slippage, or execution risk.
WebSocket data is provided by Deriv's public API. The accuracy and availability of data depend on Deriv's infrastructure and network conditions.
No financial advice is provided by this tool. Consult a licensed financial advisor before making any trading decisions.
Advanced Insights & Tools
Digit Heatmap
Visualize digit frequency across rolling windows with a color-coded heatmap. See which digits (0-9) are hot or cold over time, helping you identify trends and patterns in your selected market. The heatmap updates in real-time as new ticks arrive.
Streak & Reversal Statistics
Analyze how often streaks of length X continue versus break. Understand the probability of streak continuation and reversal patterns in your market. This module tracks both even/odd and rise/fall streaks, providing deeper insight into momentum behavior.

Volatility Meter
Measure tick-to-tick price changes and calculate standard deviation to gauge market volatility. The volatility meter helps you understand how stable or erratic price movements are within your rolling window, informing your analysis strategy.

Transition Matrix
Explore the probability of digit B following digit A with a comprehensive transition matrix. This advanced tool reveals sequential digit patterns, showing you which digits are most likely to appear after each other based on historical tick data.
Moving Averages & Live Chart
Track Simple Moving Average (SMA) and Exponential Moving Average (EMA) on a mini live price chart. Visualize price trends and smoothed data alongside raw tick movements, giving you multiple perspectives on market direction and momentum.
Over/Under Barrier Analysis
Set a custom barrier from 0 to 9 and analyze the percentage of ticks that fall over, under, or equal to your threshold. View the full distribution to understand how digits cluster around your chosen barrier, with visual charts and real-time statistics.
Configurable Alerts
Set custom thresholds for any analysis module and receive instant alerts when conditions are met. Choose from audio beeps or visual flashes to stay informed of significant statistical deviations, such as even digits exceeding 60% or a digit gap reaching a critical level.
Dark Mode & Responsive Design
Switch between light and dark themes for comfortable viewing in any environment. The mobile-first responsive design ensures all features work seamlessly on smartphones, tablets, and desktops. Enjoy a clean, modern interface with CSS variables for easy customization.
Powerful Analysis Modules
Track the distribution of even versus odd digits in real-time. View current streak length, longest streak recorded, and visualize the last 20 digits as color-coded dots. Perfect for spotting patterns in digit behavior across your selected market.
Monitor tick-to-tick price movements with precision. Calculate the percentage of rising versus falling ticks, track consecutive movement streaks, and compare short-term momentum (last 10 ticks) against medium-term trends (last 50 ticks) for deeper market insight.
Visualize the frequency of each digit from 0 to 9 with interactive bar charts. Instantly identify the hottest and coldest digits, and track digit gaps showing how many ticks have passed since each digit last appeared in your selected market.


How It Works
-
01
Connect to Deriv WebSocket
The tool automatically establishes a secure WebSocket connection to Deriv's API using your app ID. The connection status indicator shows when you're live and ready to receive tick data. If the connection drops, auto-reconnect kicks in to restore your stream without manual intervention.
-
02
Select Market & Window Size
Choose your preferred synthetic index from the market selector—Volatility 10, 25, 50, 75, 100, or their 1-second variants. Then set your rolling window size (50, 100, 500, or 1000 ticks) to determine how much historical data feeds into your analysis. The tool subscribes to live ticks for your selected market.
-
03
Analyze Live Data
As ticks stream in, the tool updates all analysis modules in real-time. Explore Even/Odd distributions, Rise/Fall momentum, digit frequency charts, Over/Under barriers, heatmaps, transition matrices, and more. Each module provides visual insights and statistical breakdowns to help you understand current market behavior.
-
04
Review Signals & Insights
Check the Signal Panel for Bullish, Bearish, or Neutral labels on each module, complete with strength scores from 0 to 100. Review advanced insights like streak statistics, volatility meters, and moving averages. Set custom alert thresholds to get notified when specific conditions are met, helping you stay on top of market patterns.
-
05
Paper Trade & Export
Use the paper-trade simulator to log virtual trades based on your analysis. Track your win rate, profit and loss, and refine your approach without risking real money. Export your tick history and trade log to CSV for offline analysis, backtesting, or record-keeping. Remember, this is for educational purposes only.

Interactive Tour
Explore the Interface
Discover the key features that power your analysis workflow
Launch dashboard
Everything your team is shipping, in one view.
Live Connection Status
Real-time WebSocket connection indicator with auto-reconnect. Always know your data stream status.
Market Selector
Choose from Volatility 10, 25, 50, 75, 100 and their 1-second variants. Switch markets instantly.
Rolling Window Control
Select your analysis depth: 50, 100, 500, or 1000 ticks. Adjust granularity to match your strategy.
Analysis Modules
Tabbed interface for Even/Odd, Rise/Fall, Matches/Differs, and Over/Under analysis with live updates.
Signal Panel
Bullish, Bearish, or Neutral signals with strength scores from 0-100 based on statistical deviation.
Paper Trade Simulator
Log virtual trades, track win rate and P/L without risking real money. Export history to CSV.
Live Market Coverage
Frequently Asked Questions
What markets can I analyze with this tool?
The tool supports all major Deriv synthetic indices including Volatility 10, 25, 50, 75, 100, and their 1-second variants. You can switch between markets instantly using the market selector dropdown, and the tool will automatically subscribe to live tick data for your chosen index via the Deriv WebSocket API.
How does the rolling window work?
The rolling window determines how many recent ticks are included in your statistical analysis. You can choose from 50, 100, 500, or 1000 ticks. As new ticks arrive, the oldest ticks are removed to maintain your selected window size. Larger windows provide more stable statistics but may be slower to reflect recent changes, while smaller windows are more responsive to current market behavior.
Can I use this tool to predict future ticks?
No. Deriv synthetic indices are generated by cryptographically secure random number generators, making each tick independent and unpredictable. This tool shows you historical patterns and statistical distributions, but past performance does not predict future results. Use the analysis to understand market behavior, not as a guarantee of future outcomes.
What is the Signal Panel and how do I interpret it?
The Signal Panel analyzes each module's statistics and labels them as Bullish, Bearish, or Neutral based on deviation from expected values. For example, if even digits appear more than 60% of the time, the Even/Odd module might show a Bullish signal. Each signal includes a strength score from 0 to 100. Remember, these signals reflect past data only and do not predict future ticks.
How does the paper-trade simulator work?
The paper-trade simulator lets you log virtual trades without risking real money. You can record your entry point, direction, and outcome based on subsequent ticks. The tool tracks your win rate, profit and loss, and trade history. You can export your results to CSV for further analysis. This is purely for educational purposes and does not execute real trades on Deriv.
What happens if my connection drops?
The tool includes auto-reconnect functionality. If your WebSocket connection to Deriv is interrupted, the status indicator will alert you and the tool will automatically attempt to reconnect. Once reconnected, live tick data will resume streaming. Your rolling window will continue from the point of reconnection, so you may see a brief gap in data during the outage.
Can I set custom alerts for specific conditions?
Yes. The tool includes configurable alert thresholds. For example, you can set an alert to beep or flash when even digits exceed 60%, or when a specific digit hasn't appeared for a certain number of ticks. Customize your thresholds in the settings panel to match your analysis preferences and receive real-time notifications when conditions are met.
Is this tool mobile-friendly?
Absolutely. The interface is built with a mobile-first responsive design, ensuring all analysis modules, charts, and controls work seamlessly on smartphones and tablets. The tabbed layout adapts to smaller screens, and touch interactions are fully supported. You can analyze markets and track statistics on the go with the same functionality as the desktop version.
Ready to Analyze Deriv Markets?
Start exploring real-time tick data, advanced statistical insights, and pattern tracking across all major Deriv synthetic indices. Whether you're learning market behavior or refining your analysis skills, the Deriv Digit Analysis Tool gives you the data and visualizations you need. Remember, this is for educational purposes—trade responsibly and never risk more than you can afford to lose.